Classic Hexbeam - Measurements (Part1)
This page presents a series of SWR measurements and azimuth plots made on my Mk2 4-band Classic Hexbeam which covers 20/17/15/10 meters. I did not have a reference antenna and so could not check Forward Gain. The measurements were taken with the beam baseplate about 20ft above ground level and with half the beam overhanging a 14ft garage roof.
Azimuth plots were made by rotating the beam in 15 degree intervals and at each step noting the strength of a received signal. The signal source was my ZM-30 antenna analyser (approx 1mW output) connected to a home-made "Buddipole" (loaded horizontal dipole) which was elevated on a temporary fibreglass mast to put it at about the same height as the Hexbeam; the source was approximately 200ft from the beam.
The signal strength was measured by adjusting a laboratory-grade stepped attenuator between the Hexbeam and the receiver to produce a Strength 9 reading on the S meter. This arrangement avoids the necessity for a calibrated S meter and made it easy to spot a 1dB change in signal strength - with practice I could see a 0.5dB change.
I settled on this measurement method after some frustration with other techniques and mistrust of the results I was getting. I discovered that it is very important to ensure that the signal from the test source is horizontally polarised otherwise you end up measuring the vertically polarised azimuth response of the antenna. I learned the hard way that you need to use a resonant horizontal antenna for the test source, and to take special care to keep common mode currents off its vertical feeder.
1. SWR, F/B and Azimuth plots
10m:
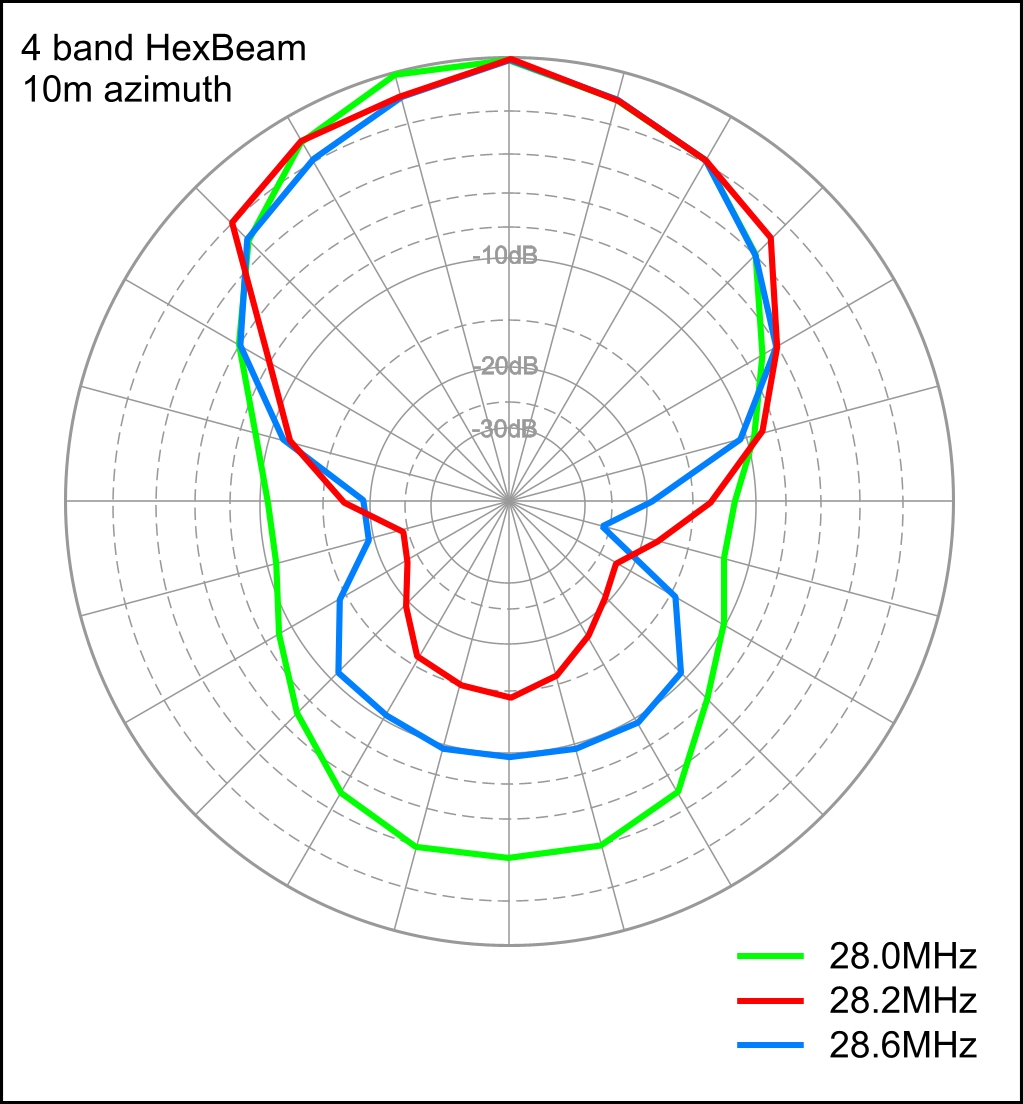
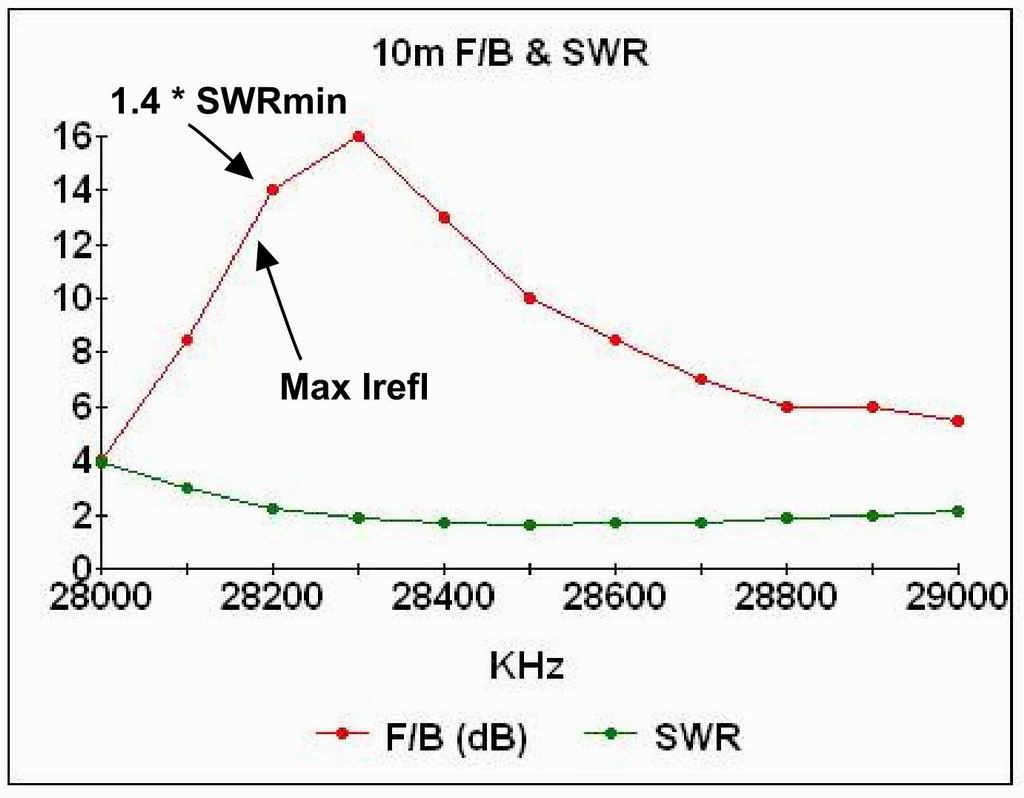
The charts above show the 10m beam performance. The SWR and F/B curves are "classics". The F/B peaks at 16dB and falls abruptly at lower frequencies; it degrades more gradually at higher frequencies. The F/B exceeds 10dB over a bandwidth of about 400KHz as expected.
At the frequency of maximum F/B the SWR is 1.9:1 - it falls at higher frequencies and rises rapidly at lower frequencies.
Also plotted on the chart are the frequencies of best beam performance predicted by two tuning methods - maximum Reflector current and "SWR = 1.4 * SWRminimum. Both predictions are slightly low in frequency, but would give acceptable results for most practical purposes.
The azimuth plots are interesting. The red curve shows the response at 28.2 MHz - close to the frequency of best F/B. The green curve illustrates how dramatically the azimuth pattern deteriorates if the frequency is lowered by just 200 KHz; on the other hand increasing the frequency by 400 KHz produces an azimuth pattern that is still quite respectable.
15m:
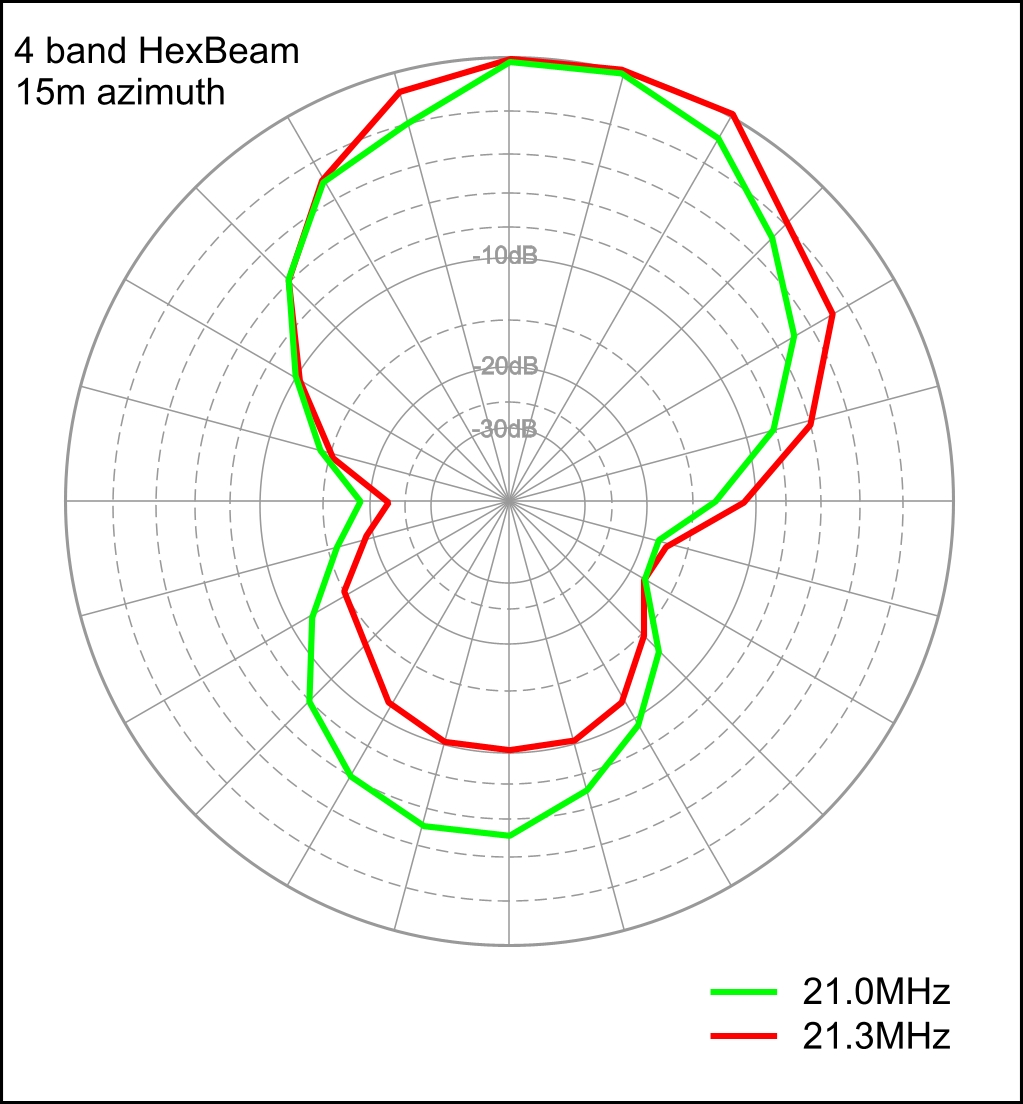
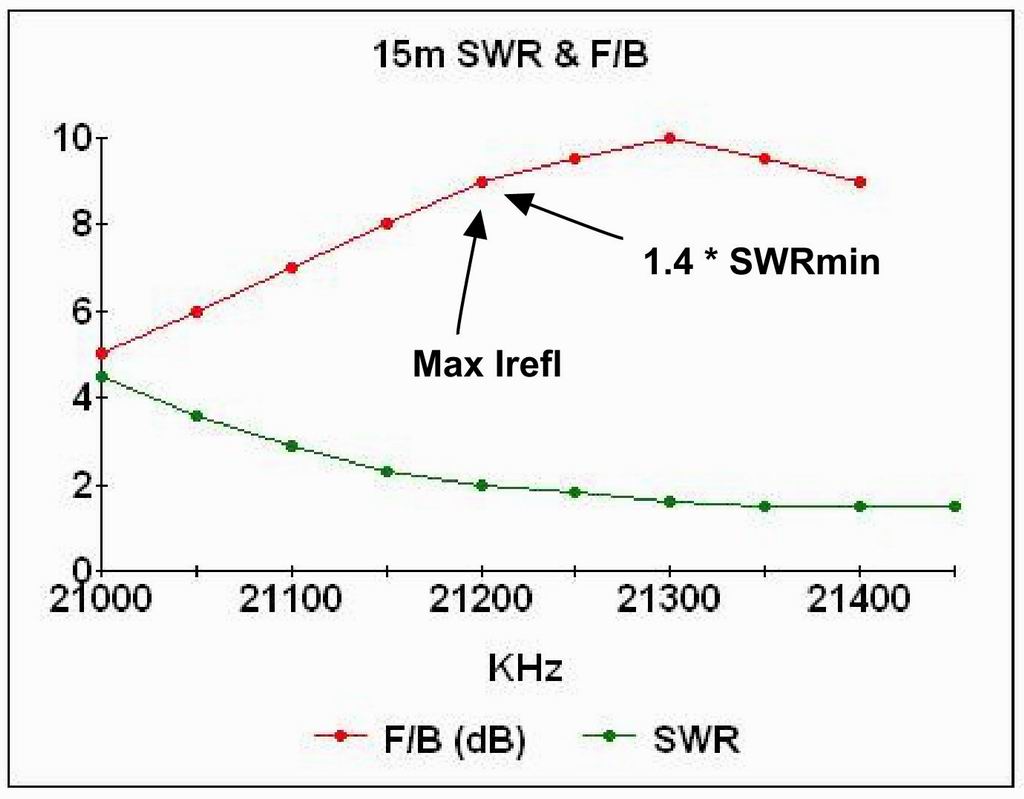
The beam wire dimensions were deliberately chosen to tune the beam towards the high end of the 15m band. The results confirm this, with best F/B occurring at about 21300 KHz. In retrospect this was a bit too high, and I added a small link at the centre of the Reflector the next time I worked on the antenna.
The F/B curve and the two azimuth plots show much less sign of a dramatic fall-off in F/B at lower frequencies; the F/B performance also seems to be several dB inferior to 10m although we have to remember that the height above ground (expressed in wavelengths) is quite different for the two bands.
Again the two tuning methods are predicting best F/B slightly low in frequency, but the 100KHz error is probably acceptable for most practical purposes.
17m:
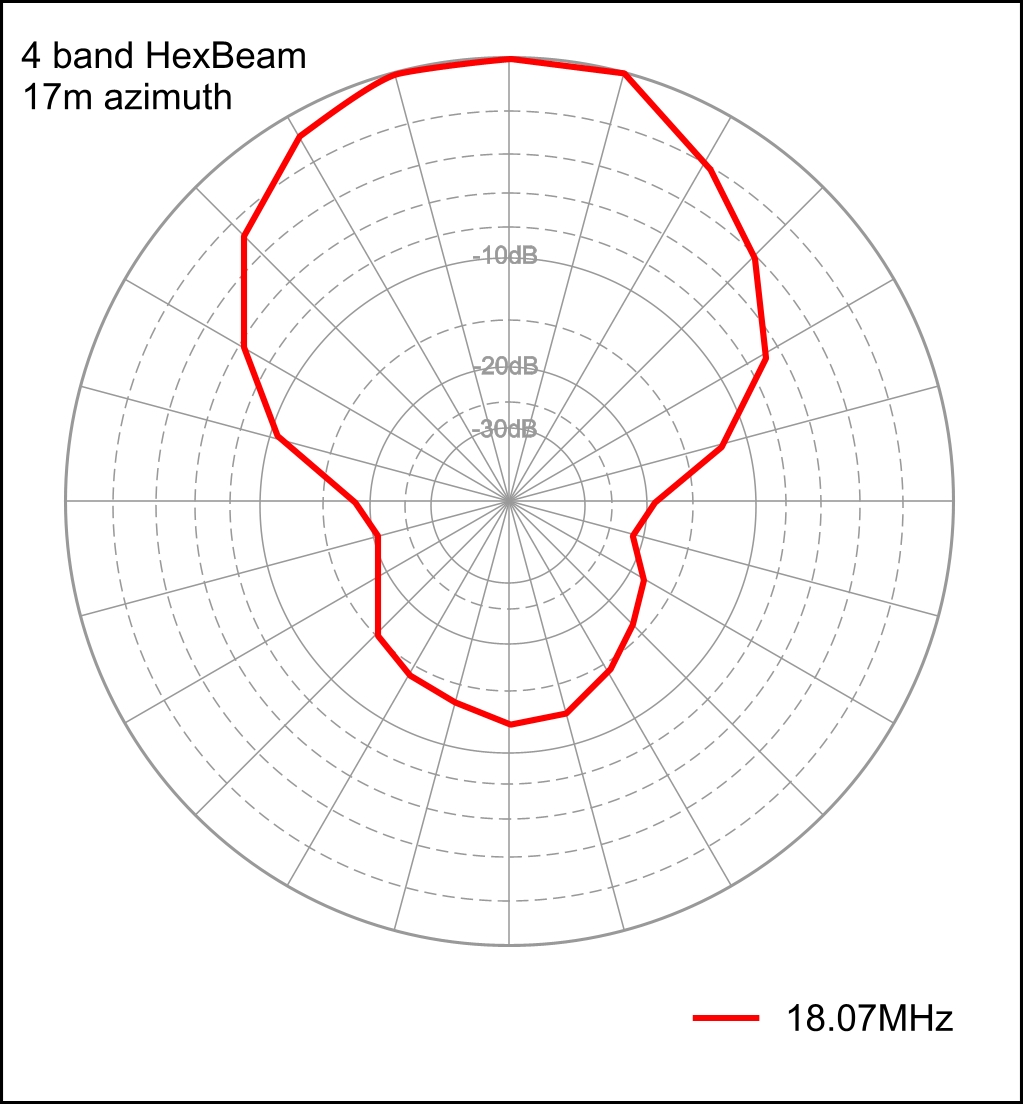
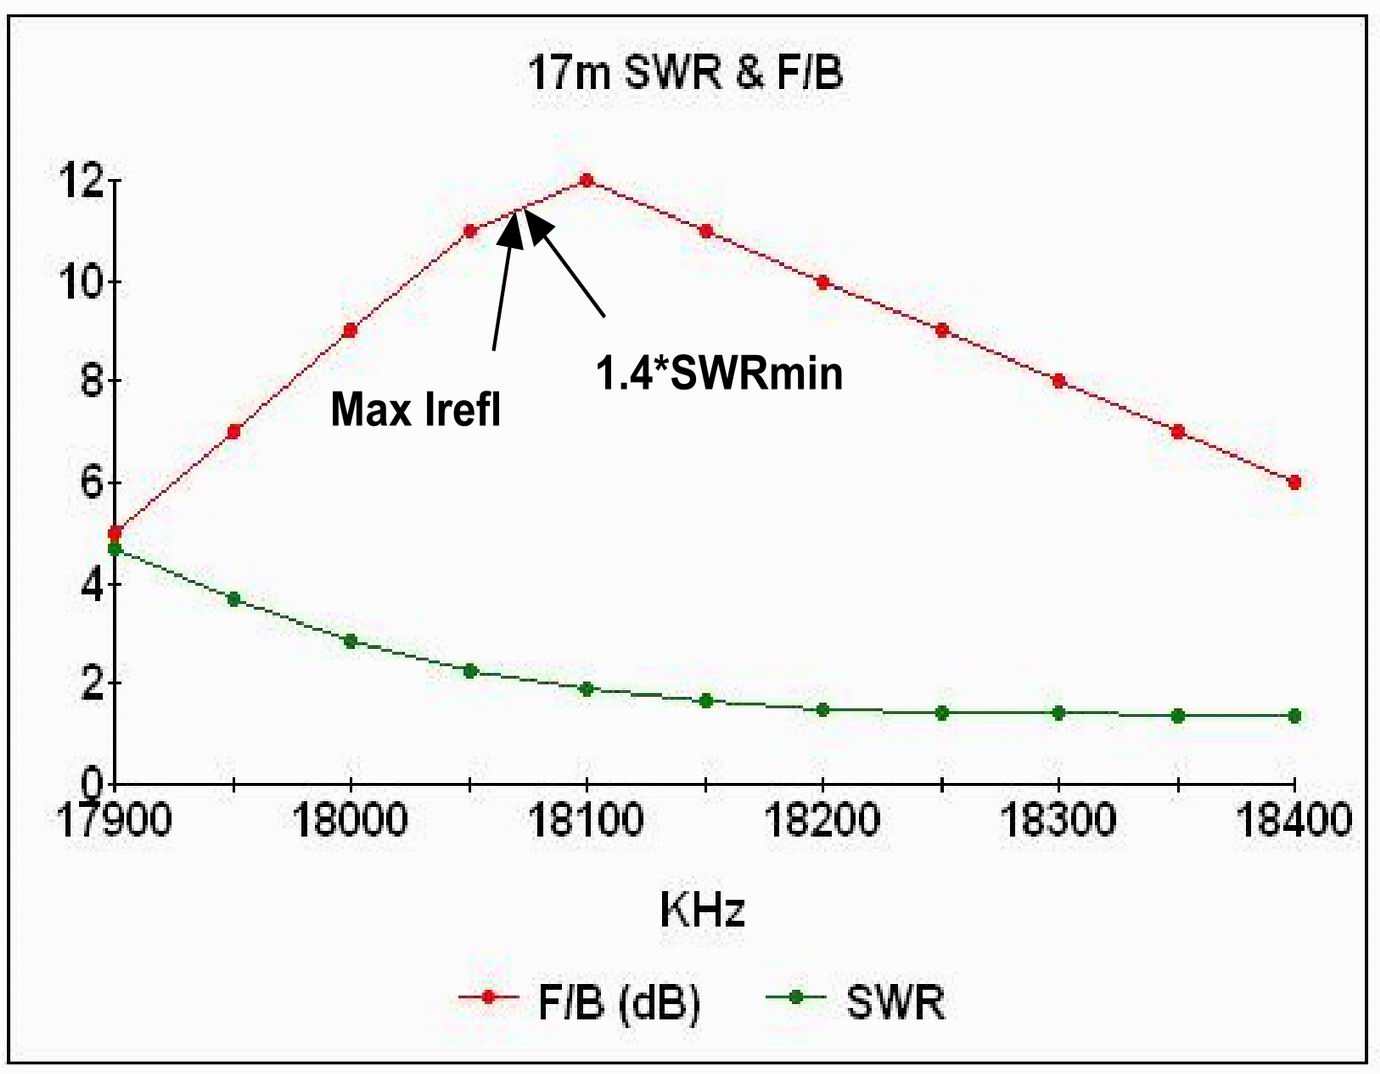
The 17m SWR and F/B charts are again "classics"; the F/B curve peaks at 12dB and is skewed, whilst the SWR rises steeply below the frequency of best F/B. The two tuning methods predict the frequency of best F/B to an accuracy of 30KHz. The amateur band is quite narrow in percentage terms, and so it was necessary to extend the measurements well outside the band in order to see the characteristic shapes.
20m:

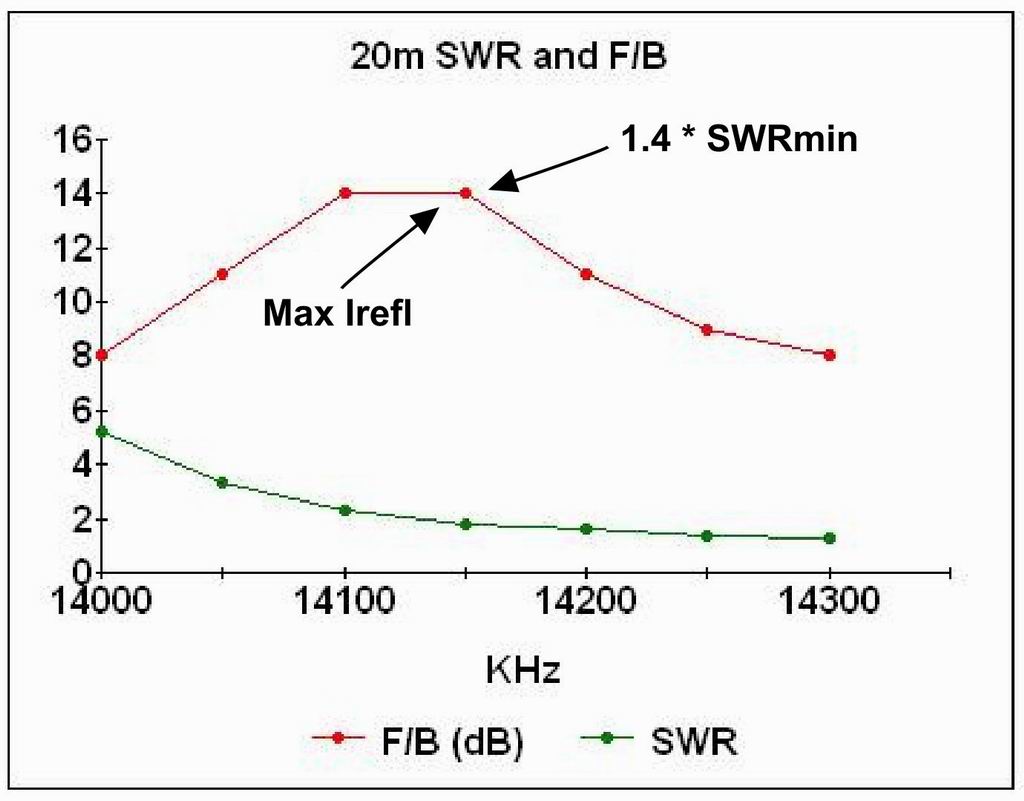
On 20m the F/B peaks at about 14dB between 14100 KHz and 14150 KHz. The F/B curve shows evidence of faster degradation at lower frequencies but it is not as pronounced as on 10m or 17m. The bandwidth over which the F/B exceeds 10dB is 200 KHz.
Both tuning methods do a pretty good job of predicting the frequency of best F/B.
I carried out only limited "on air" testing with other Amateur Stations. The few F/B measurements I made - both transmitting and receiving - produced values that were somewhat better than the figures presented here. For example I typically measured F/Bs of around 18dB on 17m compared to a peak figure of 12dB when range testing. This may simply be a result of different elevation arrival angles between the "on air" signals and the test source signal, but I note that Mike Traffie claims on his commercial Hexbeam website to see the same sort of improvement with sky-wave signals compared to line-of-sight signals.
2. Comparison with recommended dimensions
| Reflector length (ins) |
Predicted frequency (KHz) |
Measured frequency (KHz) |
Difference |
| 219.75 | 14,098 | 14,125 | + 27 KHz |
| 170.5 | 18,141 | 18,100 | - 41 KHz |
| 145.25 | 21,211 | 21,300 | + 89 KHz |
| 109.25 | 28,312 | 28,300 | - 12 KHz |
It is interesting at this point to compare the measured beam tuning with the 5 band wire dimensions recommended on the Classic Hexbeam Basics page. Scaling the frequencies to take account of my slightly different Reflector lengths, and adding the correction factors tabulated in 'Multiband Tuning (Part 2)' for the absence of 12m, we can compare the predicted frequencies with the measured frequencies as follows:
The agreement is very close indeed - the differences are comparable with my measurement intervals. My conclusion is that the recommended dimensions are robust and repeatable.