Amateur Radio (G3TXQ) - Wet Ladderline
Introduction
A doublet antenna fed via ladderline from a tuner is a popular solution to the requirement for a low-cost, multiband, HF antenna system. However, a question sometimes arises about losses in the ladderline, and how they change when the line is wet.
Wes Stewart, N7WS, carried out measurements on commercial 450Ω line and reported quite large increases in loss when the line was wet; his work was published in the ARRL Antenna Compendium Volume 6. In the November 2009 edition of QST magazine Joel Hallas W1ZR and Bob Allison WB1CGM published the results of related experiments and reported much smaller losses. Intrigued by the differences, I set out to conduct some experiments of my own!
Experimental method
I tried various methods to measure changes in loss, including driving the line with a known power and measuring changes in the current delivered to a load resistor. However, I found that the most repeatable method was to measure the line loss directly as an S21 measurement in a 50Ω system using a VNA2180 2-port Vector Network Analyser; then, having measured the input impedance of the line, to correct the S21 figure for the source mismatch loss. I believe this method was very similar to that used by N7WS, although his measurements were made between 50MHz and 150MHz whilst mine were made between 1MHz and 30MHz.
Of course using this method the line is not matched, but is operating with an SWR of 6:1 (300Ω) or 9:1 (450Ω); however it avoids the need for 6:1 and 9:1 baluns, and arguably is more representative of real world applications where ladderline is often operated at a high SWR. [But see later section for some matched line loss results.]
Net losses and Velocity Factor were calculated at frequences where the electrical line length was a multiple of a half-wavelength and the input resistance was a nominal 50Ω; an estimate was also made of Zo, using line input resistances measured at adjacent frequences where the electrical line length was an odd multiple of a half-wavelength.
A 1:1 current balun was used at each end of the line; each balun had a choking impedance of >4kΩ above 3.5MHz, and >8kΩ from 10MHz thru 30MHz. The baluns and the coax leads connecting them to the analyser were included as elements within the VNA2180 calibration process.
For tests where the line was elevated it was suspended in a straight line between two plastic garden chairs, with a third chair providing support at the centre to reduce the sag. At its lowest point the line was 24" above ground.
Results (300Ω line)

My initial work was carried out on a 60ft length of commercial 300Ω line which I had to hand; I reasoned that the large changes that N7WS reported on his 450Ω line - if real - would likely also show up on my 300Ω line. The US manufactured line consisted of two 20AWG stranded copper conductors with black PE insulation spaced 0.275” apart. The “windows” occupied about 47% of the length.
Test 1
60ft of new 300Ω line (SWR=6:1) suspended 24" above ground:
| Freq | 6.68MHz | 13.48MHz | 20.24MHz | 27.00MHz |
| Net loss (60ft) | 0.46dB | 0.57dB | 0.69dB | 0.71dB |
| Velocity Factor | 0.814 | 0.822 | 0.823 | 0.823 |
| Estimated Zo | 289Ω | 294Ω | 295Ω | 297Ω |
Test 2

60ft of 300Ω line (SWR=6:1) suspended 24" above ground and dowsed with rain water from a butt using a hand sprayer:
| Freq | 6.56MHz | 13.16MHz | 19.84MHz | 26.44MHz |
| Net loss (60ft) | 0.62dB | 0.78dB | 0.88dB | 0.93dB |
| Velocity Factor | 0.800 | 0.802 | 0.806 | 0.806 |
| Estimated Zo | 279Ω | 286Ω | 286Ω | 287Ω |
Note: a small increase in loss; a 2% drop in Velocity Factor.
Test 3
N7WS noted that “water tended to bead up and run off, making it difficult to make meaningful measurements.” I observed something similar - see Test 2 photo - although my measurements were repeatable. N7WS reckoned that a typical line used outdoors would quickly lose its water shedding ability as it degrades from sunlight and accumulates dust and other pollutants; to simulate this, he added a wetting agent to the water to create a water film on the surface. I tried to replicate what N7WS did by adding a few drops of washing-up liquid to the rain water and running the measurements again:
| Freq | 5.84MHz | 12.44MHz | 19.04MHz | 25.52MHz |
| Net loss (60ft) | 6.22dB | 7.32dB | 7.52dB | 8.10dB |
| Velocity Factor | 0.712 | 0.758 | 0.774 | 0.778 |
| Estimated Zo | 265Ω | 279Ω | 282Ω | 280Ω |
Note: large increases in loss; 5.5% drop in Velocity Factor.
Test 4
For comparison with W1ZR's experiments, I dried the 300Ω line and laid it directly in contact with the dry paving that it had been suspended above in Tests 1-3:
| Freq | 6.20MHz | 12.56MHz | 18.96MHz | 24.92MHz |
| Net loss (60ft) | 0.95dB | 1.63dB | 2.34dB | 2.56dB |
| Velocity Factor | 0.756 | 0.766 | 0.771 | 0.760 |
| Estimated Zo | 266Ω | 252Ω | 248Ω | 262Ω |
Note: large increase in losses compared to elevated line; 7.7% drop in Velocity Factor.
Test 5
60ft of 300Ω line (SWR=6:1) laid directly on the damp soil of a flower border:
| Freq | 6.48MHz | 13.00MHz | 19.56MHz | 26.16MHz |
| Net loss (60ft) | 0.97dB | 1.69dB | 2.27dB | 2.91dB |
| Velocity Factor | 0.790 | 0.792 | 0.795 | 0.797 |
| Estimated Zo | 269Ω | 270Ω | 265Ω | 279Ω |
Note: similar losses to lying on paving, but higher Zo and higher Velocity Factor.
Test 6
Out of curiosity, and spurred by the claim of a QRZ.COM forum “expert” that ladderline can be buried with impunity, I buried the line in the flower border soil at a depth of about 1":
| Freq | 4.88MHz | 9.80MHz | 15.08MHz | 20.24MHz | 25.96MHz |
| Net loss (60ft) | 2.71dB | 4.43dB | 5.50dB | 6.91dB | 7.25dB |
| Velocity Factor | 0.595 | 0.597 | 0.613 | 0.617 | 0.633 |
| Estimated Zo | 196Ω | 198Ω | 208Ω | 212Ω | 259Ω |
Note: very high losses; very low Velocity Factor; low and variable Zo.
Results (450Ω line)

For a more direct comparison with the work of N7WS and W1ZR, a 60ft length of 450Ω ladderline was purchased from a UK supplier. This US manufactured line consisted of two 18AWG (1mm) copper-clad-steel conductors with black insulation spaced 0.85" apart - similar to Wireman 551. The “windows” occupied about 40% of the length.
Test 7
60ft of new 450Ω line (SWR=9:1) suspended 24" above ground:
| Freq | 7.38MHz | 14.73MHz | 22.12MHz | 29.51MHz |
| Net loss (60ft) | 0.42dB | 0.53dB | 0.71dB | 0.73dB |
| Velocity Factor | 0.900 | 0.898 | 0.899 | 0.899 |
| Estimated Zo | 374Ω | 365Ω | 351Ω | 347Ω |
Note: Zo much lower than the nominal 450Ω.
Test 8

60ft of 450Ω line (SWR=9:1) suspended 24" above ground and dowsed with rain water from a butt using a hand sprayer:
| Freq | 7.19MHz | 14.44MHz | 21.69MHz | 28.98MHz |
| Net loss (60ft) | 0.48dB | 0.60dB | 0.80dB | 0.82dB |
| Velocity Factor | 0.877 | 0.880 | 0.881 | 0.883 |
| Estimated Zo | 372Ω | 362Ω | 356Ω | 344Ω |
Note: small increase in loss; 2% decrease in Velocity Factor; no change in Zo.
Test 9
As Test 8, but a few drops of washing-up liquid added to the rain water to aid water retention:
| Freq | 7.05MHz | 14.10MHz | 21.30MHz | 28.45MHz |
| Net loss (60ft) | 4.24dB | 4.74dB | 5.06dB | 5.19dB |
| Velocity Factor | 0.860 | 0.860 | 0.866 | 0.867 |
| Estimated Zo | 390Ω | 387Ω | 386Ω | 382Ω |
Note: high losses; 4% drop in Velocity Factor; increase in Zo.
Test 10
60ft of dry 450Ω line (SWR=9:1) lying on dry paving:
| Freq | 6.38MHz | 12.76MHz | 19.48MHz | 25.96MHz | 32.68MHz |
| Net loss (60ft) | 1.27dB | 2.33dB | 3.17dB | 3.61dB | 3.89dB |
| Velocity Factor | 0.778 | 0.778 | 0.792 | 0.791 | 0.797 |
| Estimated Zo | 327Ω | 352Ω | 355Ω | 340Ω | 290Ω |
Note: significant increase in losses, and changes in Velocity Factor.
Test 11
60ft of dry 450Ω line (SWR=9:1) suspended 24" above ground, with middle 11ft lying against aluminium ladder:
| Freq | 7.16MHz | 14.28MHz | 21.72MHz | 28.92MHz |
| Net loss (60ft) | 0.49dB | 0.53dB | 0.92dB | 0.98dB |
| Velocity Factor | See note | See note | See note | See note |
| Estimated Zo | See note | See note | See note | See note |
Note: small increase in losses at higher frequencies; TDR measurement confirmed that the 11ft section of line in contact with the aluminium ladder has a different Zo and Velocity Factor - overall figures for the whole 60ft are therefore a little meaningless.
Test 12
60ft of 450Ω line (SWR=9:1) suspended 24" above ground, during heavy rain:
| Freq | 6.72MHz | 13.40MHz | 20.12MHz | 27.16MHz |
| Net loss (60ft) | 1.08dB | 1.12dB | 1.66dB | 1.27dB |
| Velocity Factor | 0.819 | 0.817 | 0.818 | 0.828 |
| Estimated Zo | 362Ω | 422Ω | 373Ω | 296Ω |
Note: some inconsistency in the results, probably caused by the variation in rainfall during the period of the test. Results closer to those of Test 8 than Test 9
Discussion
- Spraying the lines with rain water caused a small increase in loss that would probably be
unnoticeable in normal operation. However, the change in Velocity Factor is sufficient that a
tuner connected to a ladderline/doublet system would likely need some re-adjustment because
of the difference in transformed impedance.
- Adding a wetting agent to the rain water caused a large increase in loss - comparable to the
losses observed by N7WS. However, these losses recovered to dry levels over a relatively short period of
time, as follows at the frequency where line is 2λ long:
0 mins: 5.2dB
+10 mins: 1.83dB
+30 mins: 0.73dB
+60 mins: 0.72dB
Interestingly the 300Ω line losses recovered more slowly, and they never fully recovered to dry levels until the line was throughly cleaned; this implies that some residue was left on the line after the water had evaporated. - It is not clear whether the high losses associated with using the wetting agent were due to
the more complete wetting of the line or to some electrical properties of the agent. Nor is it clear
how well this test represents conditions that will be experienced in the "real world".
N7WS' view was that the results: "are probably worst case and not something that would necessarily
be encountered in a typical installation."
- Laying the ladderline in contact with the ground produced high losses and large reductions in
the Velocity Factor - results similar to those reported by W1ZR.
- Clearly, ladderline cannot be buried with impunity despite the claims of one forum "expert"!
- A section of ladderline in contact with aluminium exhibited a different Zo and Velocity
Factor from the remainder of the line; there was a small increase in overall losses at
higher frequencies.
- The 450Ω line has been left in position so that further testing can be carried out across
a range of UK weather conditions.
Matched Line Loss

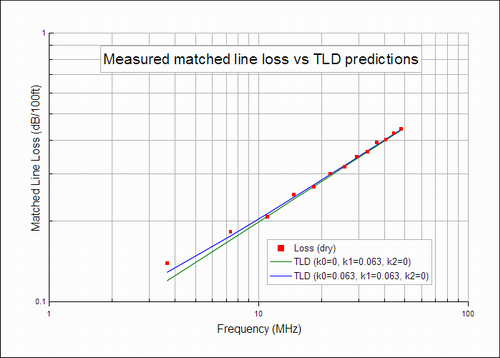
Subsequent to the above experiments, a set of measurements was made to determine the loss of the "450 Ohm" line under matched conditions. The input impedance of the line was measured with, firstly, a short-circuit termination, and then an open-circuit termination; from these impedance measurements the matched loss was determined and is shown by the red points on the chart. Equation (7) in the attached note on the underpinning maths was used to derive the loss, and Equation (12) to determine Zo.
The matched loss of many practical transmission lines can be modelled using three loss coefficients k0, k1 and k2, where k0 is associated with the DC resistance of the conductors (a constant for any given line type), k1 is associated with the "skin effect"(which varies in proportion to the square root of frequency) and k2 is associated with the dielectric loss (which varies directly with frequency). Dan Maguire's (AC6LA) Transmission Line Details (TLD) software uses these coefficients to predict line performance; the blue line on the chart shows TLD's predictions for line loss with k0=0.063dB/100ft, k1=0.063dB/100ft/SQRT(MHz), and k2=0. The value of k0 was chosen to match the measured DC resistance of the line - 3.5 Ohms for the 60ft length - and k1 to match the measured loss at 22MHz; the value of k2 cannot be deduced reliably from the data because its effect are relatively small in the HF range.These coefficient values produce predicted matched losses very close to the measured data; they also produce predicted unmatched line losses that accord reasonably well with the data in Table 7.
The green line shows how the predicted losses change if a DC coefficient is not included (k0=0).
By way of a "sanity check", the predicted loss of copper conductors of this size in air, with these characteristic impedances, would be 0.309dB/100ft at 22MHz, compared with a measured figure of 0.300dB/100ft and a TLD figure of 0.299dB/100ft.

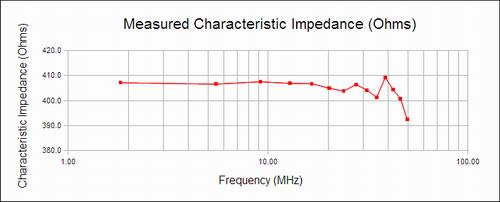
The short-circuit and open-circuit impedance measurements were also used to calculate the characteristic impedance of the line, as shown in this second chart.

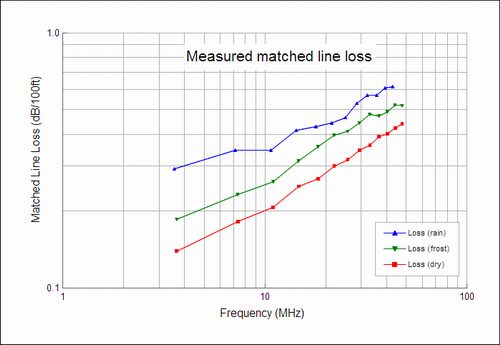
Here's how the matched loss of the "450 Ohm" line varied under a couple of different weather conditions: the blue line shows the loss during moderate rainfall; the green line shows the loss after a night of sub-zero temperatures when there was a layer of frost on the wire. The red line is the original "dry" loss.

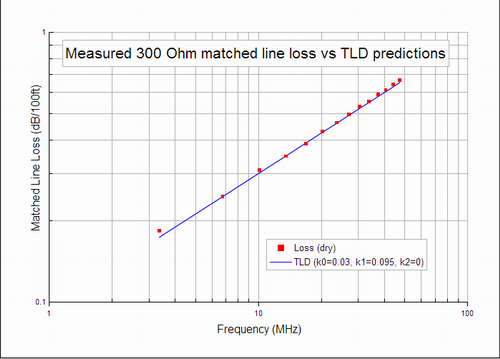
Finally, the red points on this chart show the measured matched loss of the 300 Ohm line when dry. Zo was measured to be 295 Ohms and Vf measured 0.81.
The blue line is the loss predicted by TLD using a k0 coefficient of 0.03dB/100ft - chosen to match the measured DC resistance of the line - and a k1 coefficient of 0.095dB/100ft/SQRT(MHz) chosen to match the measured loss at 20MHz. Based on simple copper loss calculations for 20 gauge solid copper wires, expected values of k0 and k1 should be 0.032dB/100ft and 0.1db/100ft/SQRT(MHz) respectively.